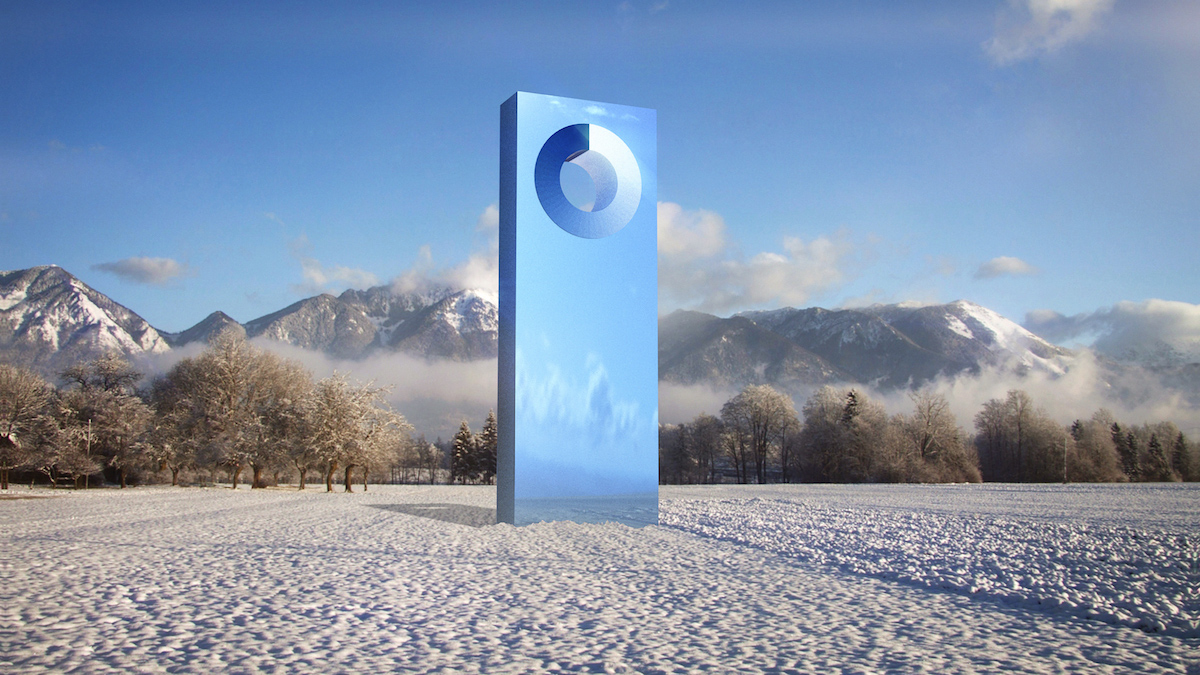
The cyanometer was invented by Geneva-based scientist Horace Benedict de Saussure in 1789. He systematically documented the blueness of the sky with his cyanometer, a simple circular tool with 53 shades of blue. He concluded that blueness is influenced by both moisture and the amount of suspended particles in the air.
The Cyanometer by Martin Bricelj Baraga is inspired by the original cyanometer. De Saussure’s blue color wheel forms the core of the monument, gently directing our gaze back to the sky. The monolith gathers data of the blueness of the sky and the quality of air and visualises them, thus becoming an instrument which raises awareness on the quality of one of the crucial elements of life. In a cloud based world, the only clouds that really matter are the ones we see in the sky

In Switzerland, the Cyanometer gathers air quality measurement data from the Etat de Genève – SABRA measuring station. The Cyanometer displays the air pollution level on a color scale from red to green and points out the main pollutant in case of pollution in real time. A color scale from green to red visualises the air quality level. In the case of increased levels of concentrations, three different icons indicate the main pollutant source, while the fourth one indicates the essential condition connected to elevated ozone concentrations.
Current Data
Pollution Index
Measurements
| Pollutant | Ozone (O3) | Particles (PM10) | Sulfur Dioxide (SO2) | Nitrogen Dioxide (NO2) |
| Concentration | 6 µg/m³ | 22 µg/m³ | µg/m³ | 24 µg/m³ |
| Main Source | / | Residential Wood Burning | Industry | Traffic |
*Particles with aerodynamic diameter less than 10 µm.
Cyanometer collects data from the Etat de Genève – SABRA measuring site. If the diagram is off, data is not available. In case of cloudy weather the level of blueness may deviate.
MORE: www.ge.ch
Credits
Martin Bricelj Baraga concept & artistic direction • Igor Vuk technical design & production • Neja Tomšič production & texts • Marjan Omanovič installation build up • Miha Markič programming • Matt Spendlove web programming • Vishal Kassie website design • Domen Dimovski 3D design • Katja Pahor design • Gašper Torkar sound design
- Production: MoTA – Museum of Transitory Art
- Supported by:
- Partner: Mestna občina Ljubljana – Zelena prestolnica Evrope 2016, ARSO – Agencija Republike Slovenije za okolje
- Co-financed by: Ministrstvo za kulturo, Turizem Ljubljana
- Sponsor: Energetika Ljubljana
The Cyanometer project was developed within the ARTECITYA network, devoted to artistic and technological innovations with the aim of improving the quality of life in cities and is co-financed by the Creative Europe.
